Statistics
In Statistics, "outlier analysis", "descriptive statistics" (including box-plots), and "advanced statistics" (ANOVA, PCA) can be performed.
Descriptive statistics is available for all WebIDQ subscription plans.
Select results for statistics
- Load data as described in Load results.
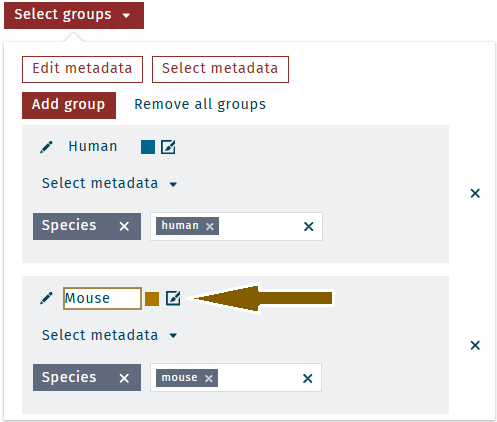
- Select metadata for statistics, click Select groups. - To select multiple attributes together, click Select metadata.- To select attributes one by one, click Add group.- To rename a group, click in the group's name, e.g. "Mouse".Example: group 1 "Human" and group 2 "Mouse".
- Select the type of statistic that sould be performed, Descriptive statistics, ANOVA, PCA.

Outlier analysis
To remove sample outliers from the loaded data, an outlier analysis can be performed before statistical calculations (Descriptive statistics, ANOVA, or PCA).
Select Outlier analysis.
Click Calculate
.
Sample outliers are shown.
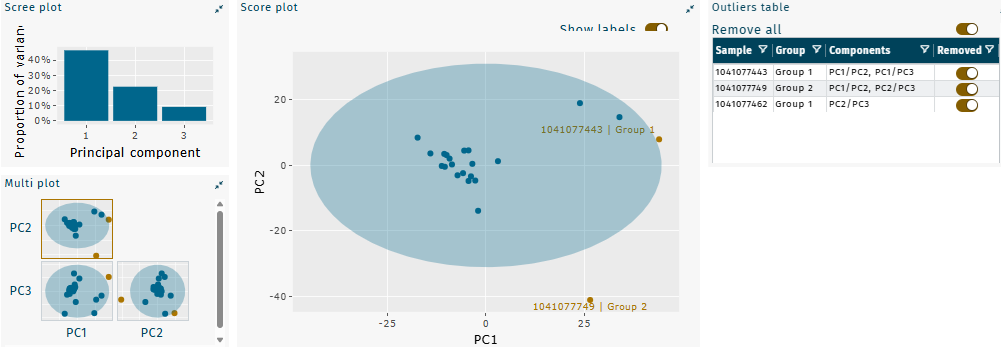
To remove sample outliers from statistical calculations, exclude selected sample or exclude all sample outliers.
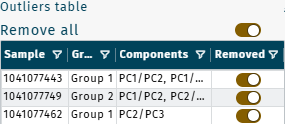
Exclude selected samples Exclude all samples 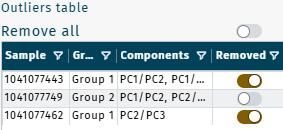
Descriptive statistics
- Select Descriptive statistics.
- To define options for statistics calculations, click Stat. options.
- Click Calculate
.
- Statistical results are shown for all unknowns, selected groups, and plots.
ANOVA
Calculations may take a minute.
- Select ANOVA.
- To define options for statistics calculations, click Stat. options.
- Click Calculate
.
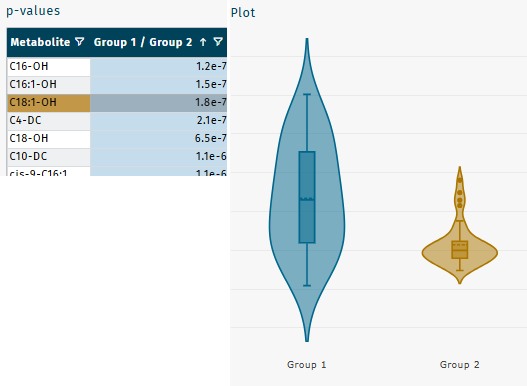
- Statistical results (p-values) are shown in a table and plots.
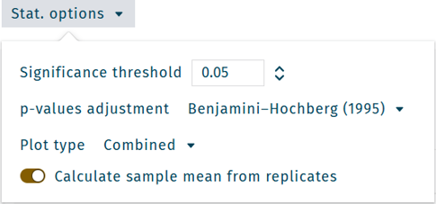
Available options
Significance threshold, e.g. 0.05
To apply changes, click Calculate.
PCA
- Select PCA.
- To define options for statistics calculations, click Stat. options.
- Click Calculate
.
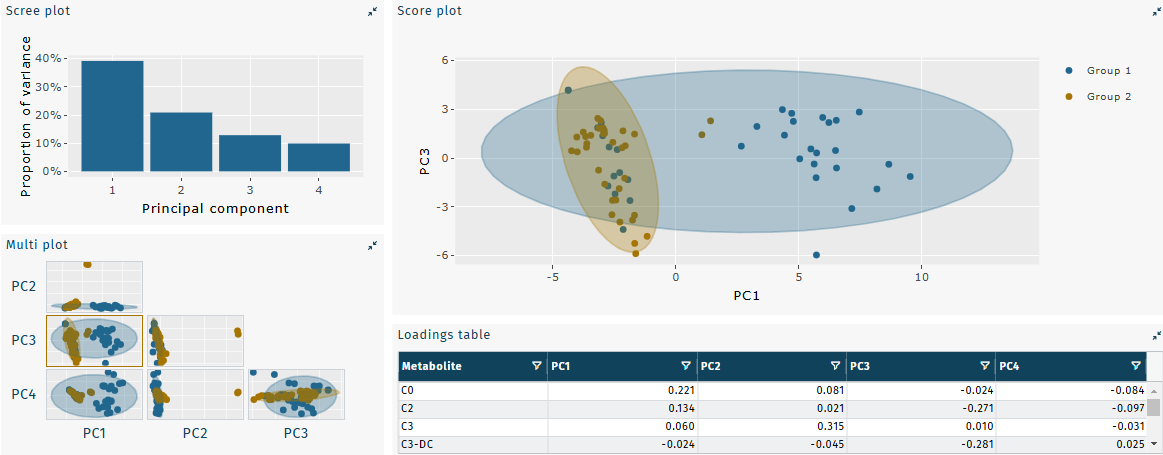
- Statistical results are shown.
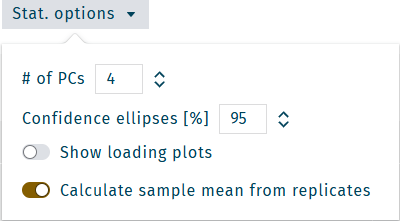
Available options
Number of principle components (PCs) shown in "multi plot", e.g. 4
To apply changes, click Calculate.
Export and information
Export
This feature is coming soon.
Information
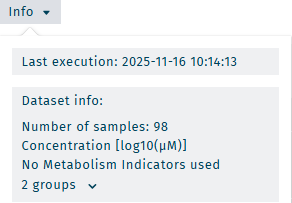
Click Info to show details of the performed statistic.
Unknowns are exclusively used for statistics.