Plots
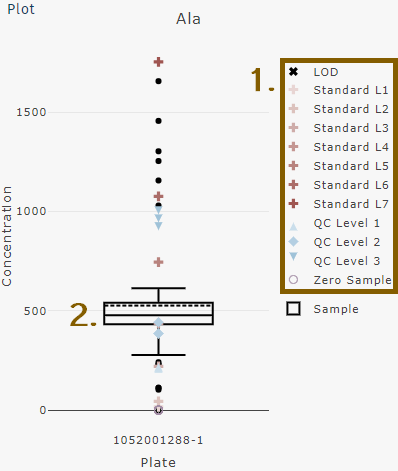
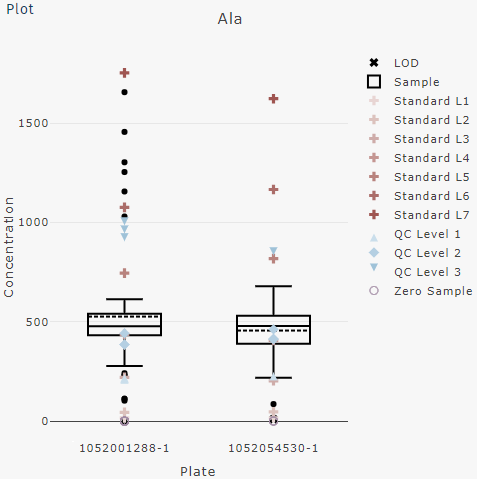
In Plots results from one kit run or multiple kit runs can be displayed. LOD, blank, zero, calibration standard, QC, and unknown sample concentrations are displayed analyte by analyte for the selected plate run. Concentrations from all unknown samples are shown as box plot.
Generate plots
- Select one or multiple plate runs, as described in section Select data to load.
- Select a Value type, e.g. "Concentration".
- Select a metabolite or multiple metabolites from the table Metabolites, e.g. "Ala".
- Plots are shown for the selected metabolite or metabolites.
 1. LOD, zero, calibration standards, and QCs2. unknown samples
concentrations as box plot
If more than one plate run is loaded, plots are shown individually for each plate run.
