Major release | 699
2024 August
Key updates
Data preprocessing

Data preprocessing is a toolset that performs data cleaning and missing value imputation on results before exporting. This process helps to create a more robust dataset for downstream statistical analysis.
New integration window features
Integration window information is shown in a new and specific column Info, see Integration windows features.
Available feature "Align RT shifts", see Align RT shifts.
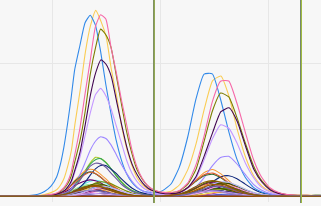
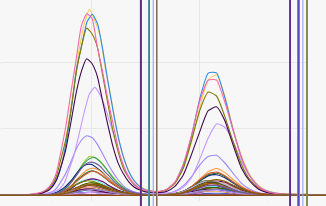
If RT shifts occurred during a plate run, to overlay all chromatograms of one metabolite activate Align RT shifts
| No "align RT shifts" | With "align RT shifts" |
|---|---|
 |  |
LOD algorithm "StdDev-based"
The limit of detection (LOD) for each metabolite within a kit run is calculated from the concentrations in the zero samples based on either
- the new algorithm standard deviation "StdDev-based" or
- the current default algorithm median "Median-based".
See LOD algorithm and Settings > LOD algorithm
Select metabolism indicators | Categories for specific diseases, lifestyle factors, and physiological functions

Two display options for metabolism indicators are available, as table or grouped, see Select metabolism indicators.
Information about metabolism indicator statuses is now available, see Metabolism indicator status.
User experiences
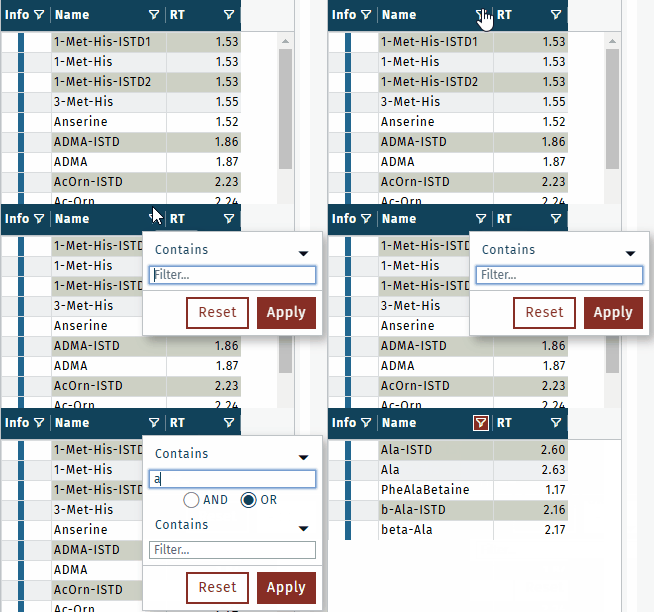
Apply filter, press enter

Apply a filter by pressing the enter key.
Quantification workflow guidance shortcuts
![]()
Clicking on the squares will take you to the respective section: Integration, Calibration, and Validation.
Number of replicates required for normalization
Define the minimum number of sample source replicates per plate run required for normalization, see Number of replicates required for normalization. The default value is three.
Example | Recreate kit plate layout with “Import plate run(s)”
An example was added, showing how to recreate a kit plate layout with “Import plate run(s)”, see Example | Recreate kit plate layout with “Import plate run(s)”.
Metabolism indicator details
In Results > Data Metabolism indicator "categories" or "analyte classes" can be shown in the results table, defined in the Settings, see Metabolism indicator details.
Plate layout
New section describing these features.
Value type
New display options are available, see Value type.
- Relative retention time [min]
- Intensity-to-peak area ratio
- Internal std. intensity-to-internal std. peak area ratio
- Intensity-to-peak width ratio
- Internal std. intensity-to-internal std. peak width ratio
- Area-to-peak width ratio
- Internal std. area-to-internal std. peak width ratio
Fixed issues
Refresh results when processing was updated
To guarantee reporting based on current data, in Results > Data the results table is cleared, when corresponding data was reprocessed in Quantification (altered calibration or validation).
Kit performance assessment
In Quantification > Validation now accuracies are calculated for every metabolite with the analyte classification "Q / Type 1".