Evaluation
Peak integration quality can be checked with Evaluation feature. This is recommended but not mandatory.
In this sections examples are given, which will support whether the peak integration windows were defined correctly or not.
- Select a value, e.g. Height/area.
- Define reference samples, e.g. QC2. Values from this sample serve as a reference and are compared with all the samples of a plate run.
- Define a threshold, range 0 - 100%. Example: 15% mean that values with a deviation greater than 15% from the reference value are highlighted in red.
- To show the corresponding chromatogram, click on a value, e.g. 42.673 of "Lys".
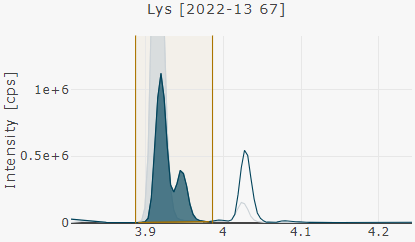
 In this example a peak co-eluting with the target peak of "Lys" was discoverd.
 - If required, peak integration can be adjusted directly in Evaluation or Integration.
After performing peak integration adjustments, integrate the plate run again.
Height/area
To check peak integration performances, "Height/area" is well suited.
- The peak height is divided by the integrated peak area.
- The "Height/area" value is stable for different metabolite concentrations.
- If an additional peak or only half of a peak was integrated, the value "Height/area" changes significantly and is highlighted in red.
- Using "Height/area threshold" values around 15% are well suited, to identify peaks with poor integration performances.
Example
- An additional peak was integrated together with the peak of "Lys" at 3.92 min.
- The "Height/area" is highlighted.
Two peaks are within the integration window. The area value is larger than the height. This results in a smaller "Height/area" value compared to chromatograms, where one peak is integrated.
- Click on the value 42.673 of "Lys" and optimize the integration.
- After performing integration adjustments, integrate the plate run again.
MRMs with concentration levels in the noise range, may be highlighted and can be ignored.
Relative retention time (Rel. RT)
If two peaks are available in one chromatogram, e.g. ADMA and SDMA, "Rel. RT" is well suited to check if the desired peak was integrated. The RT ratio of metabolite and internal standard (ISTD) peak is used. Please find an example below.
Metabolites and the corresponding ISTD have the sample RT, e.g. SDMA and SDMA-ISTD.
- As peaks e.g. of ADMA and SDMA elute close to each other, define a small "Rel. RT threshold" of 1 or 2%.
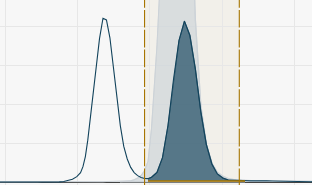
- Values are highlighted, if in this example the peak of ADMA is integrated. left peak ADMA, right peak SDMA
- Click on the highlighted value and optimize the integration.

- After performing integration adjustments, integrate the plate run.
MRMs with concentration levels in the noise range, may be highlighted and can be ignored.
Evaluation is only available for LC data.